Scale & Offset Wizard
The Scale & Offset Wizard allows you to generate non-linear scale
and offset values easily, based on measurement data entered with the Measure command.
If you have already selected nominal dimensions and entered actual dimensions,
you can generate scale and offset values.
The wizard steps you through the process of making choices and generating
values, using a series of dialog boxes referred to here as pages. To move
from one page to the next one, click the Next button at the bottom of
the window; to go back, click the Back button.
To use the wizard:
Click the Scale &
Offset command on the Print
tab, and select the Scale and Offset Wizard icon  from the command window.
Select a part, and scale and offset axes to
calculate. Step 1...
Add measurement and values for the reference
part. Step 2...
View the calculation results for the selected
axes. Step 3...
Review the figures on the quality of the regression
fitting. Step 4...
The system displays the Scale and Offset Results.
Review the results and select the parts and axes you want to apply
the scale factors to. Step 5...
The Scale and Offset Results will then be added
to the Scale and Offset command to be
applied.
Step 1
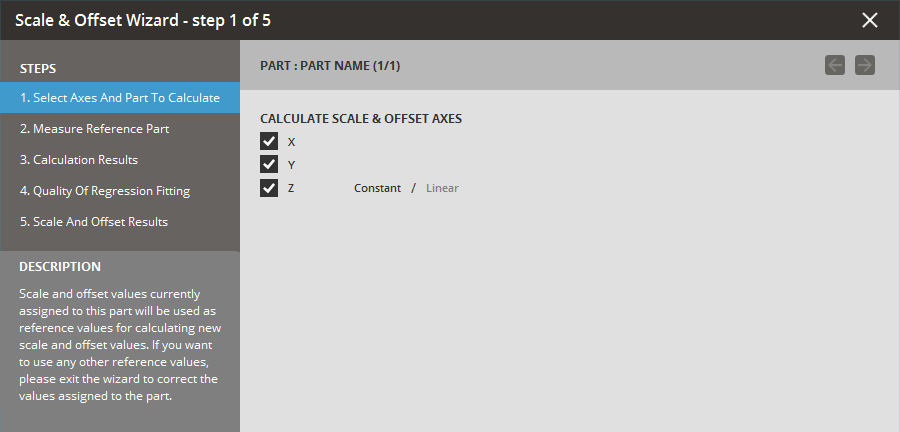
Select a part either by clicking on it in the
canvas or by using the arrows at the top right of the wizard.
Click the check boxes to determine which axes
(X, Y, and/or Z) the system will calculate.
For the Z-axis, you also need to select a scale
calculation method from Constant or Linear.
Click the Next
button; a list of parts appears.
Step 2
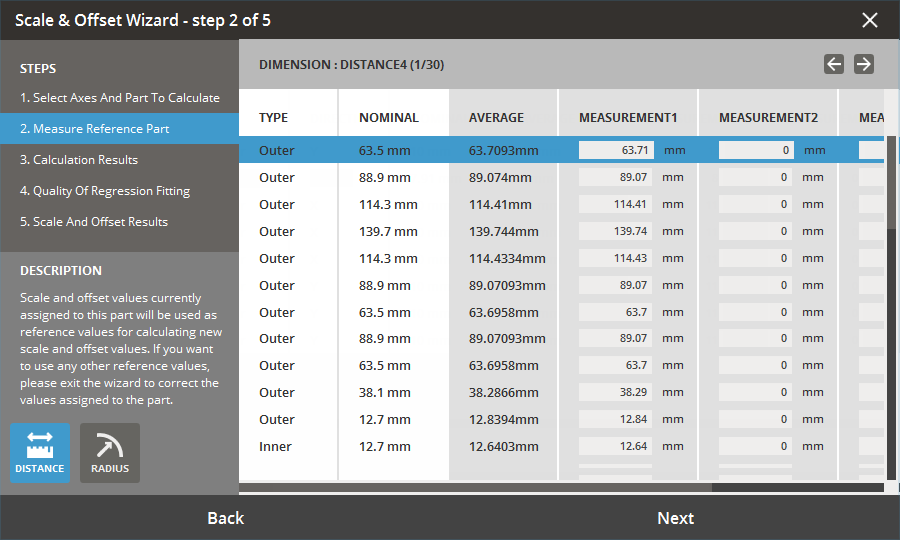
Add measurements to the selected part between selected
features, points, lines or faces wing the Distance
or Radius tools available in the
page.
Existing measurements applied with the Measure
command to the part can also be used.
Note: At least one measurement value needs to be entered for all measurements to be able
to proceed to the next step.
Step 3
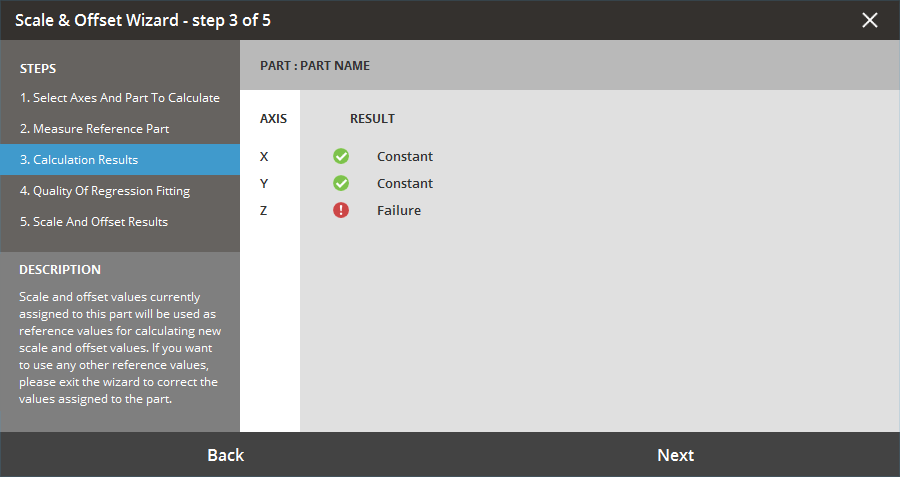
The system then displays the Calculations Results.
This displays (for each axis of each part calculated)
whether the calculation was successful. If there were insufficient dimensions
to calculate the formula you requested (or if a lower-order formula provides
a better fit), the system downgrades the formula and reports a success
with warning.
Review the results, and then click the Next
button to continue or the Back button to
add measurements or make changes.
Step 4 - List view
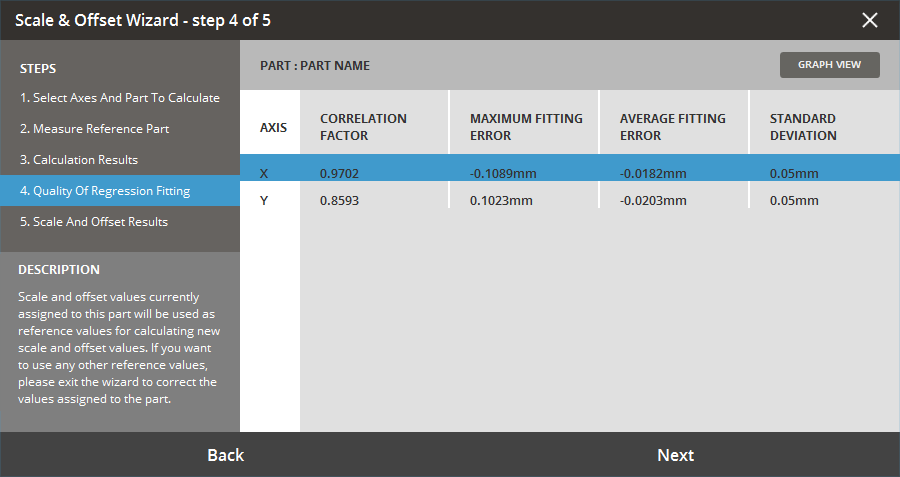
When you click the Next
button in the Calculation Results page, the system displays the regression
fitting report on a page titled Quality of the Regression Fitting.
This report shows how closely the generated scale values
fit the measurement data you supplied. Values reported include the correlation
factor, maximum fitting error, average fitting error, and standard deviation.
Each row in the table represents scale values for one axis of one part.
Graph View
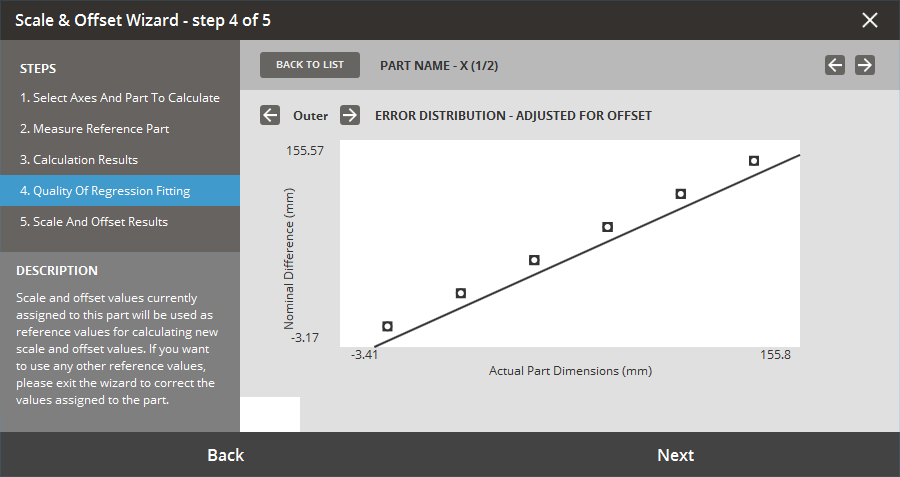
This graph is a pictorial representation of both the
actual errors and fitting errors from the data and scale type selected
as a function of the actual dimensions.
The points represent the measured dimensions' difference
from the nominals. They are adjusted for the offset so that these values
can all be displayed on one graph; therefore, the points will not correspond
directly with the calculated error values. When reviewing this graph,
check to see if there are any outlying data points that do not fit the
regression.
If there are, these dimensions should be verified in
the Measure tool.
Step 5
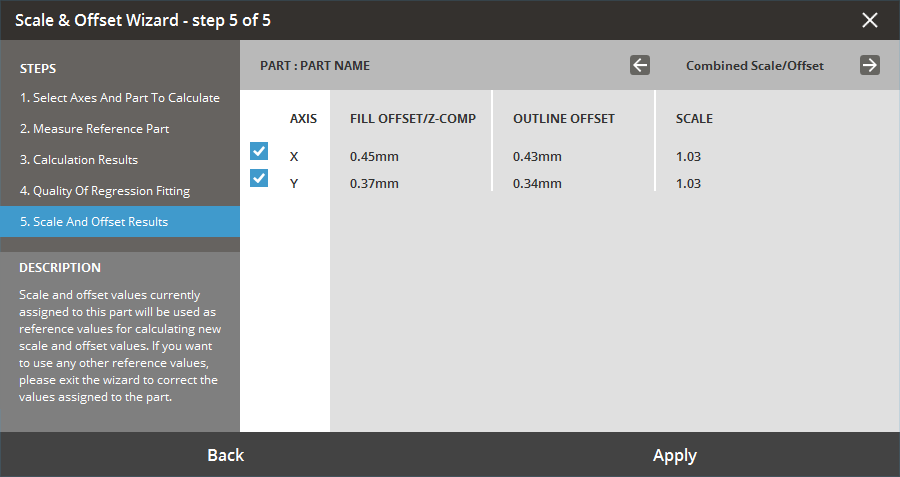
The Scale and Offset Results page displays the values
generated by the wizard.
You can review these values before applying them to
your build. Tabs on the window allow you to compare the values generated
by this calculation with the Reference Scale Values as well as the combined
values (created by combining this calculation with the reference values).
The combined values are the ones that will actually be used.
After you review the results, click the check box next
to each row whose values you wish to use, and then click the Apply
button.
This will than add the selected calculation results
to the Scale and Offset tool to be applied.
See Also
Scale and Offset